The Oracle (2)
The World Cup is now under way, after an arguably fairly lacklustre performance by the host against a tough (if possibly a bit naive) Croatian team, still resulting in a 3-1 win for Brazil. I’ll try and comment on our predictions for the first few games as they go along and the observed result is actually revealed.
So, our model predicted a very likely win for Brazil \(-\) nearly 80% chance of this outcome and only around 5% chance of a Croatian win. In fact, if we look at the entire _**joint_ predictive distribution of the results (below), 1-0 and 2-0 wins were by far the most likely outcomes for the game \(-\) incidentally, the latter coincided with the median values of the _marginal**_ distributions for the goal scored (see here).

The observed 3-1 was a bit further down the plot, meaning it was a less likely outcome \(-\) but I think it’s worth nothing that the game was quite tight at 2-1 (quite a likely outcome) until the Croatian keeper’s mistake in the very last minutes of the game. Interestingly, 1-1 (the result at the time Brazil got awarded a soft penalty) would have been even more likely.
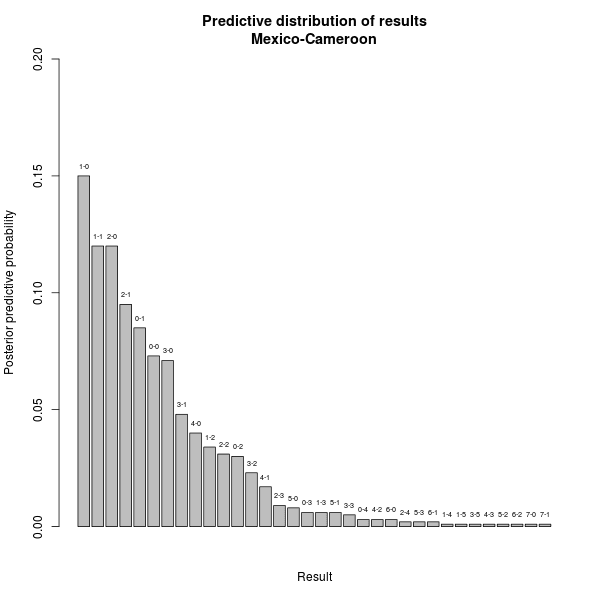
Here’re the analyses for tonight’s games. The graphs show the contour plot of the bivariate joint distribution of goals scored by the two opponents (Mexico-Cameroon; Spain-Netherlands; Chile-Australia) in the left hand side and the histogram (or technically a bar plot) showing how likely each of the possible results are (according to the predicted outcomes).
|
|
|
|
|
|
|
|
|


While probably more informative than the graphs we showed in our previous post, these are effectively in line with them. More comments later!