Snap

In the grand tradition of all recent election times, I’ve decided to have a go and try and build a model that could predict the results of the upcoming snap general election in the UK. I’m sure there will be many more people having a go at this, from various perspectives and using different modelling approaches. Also, I will try very hard to _not _spend all of my time on this and so I have set out to develop a fairly simple (although, hopefully reasonable) model.
First off: the data. I think that since the announcement of the election, the pollsters have intensified the number of surveys; I have found already 5 national polls (two by Yougov, two by ICM and one by Opinium \(-\) there may be more and I’m not claiming a systematic review/meta-analysis of the polls.
Arguably, this election will be mostly about Brexit: there surely will be other factors, but because this comes almost exactly a year after the referendum, it is a fair bet to suggest that how people felt and still feel about its outcome will also massively influence the election. Luckily, all the polls I have found do report data in terms of voting intention, broken up by Remain/Leave. So, I’m considering \(P=8\) main political parties: Conservatives, Labour, UKIP, Liberal Democrats, SNP, Green, Plaid Cymru and “Others”. Also, for simplicity, I’m considering only England, Scotland and Wales \(-\) this shouldn’t be a big problem, though, as in Northern Ireland elections are generally a “local affair”, with the mainstream parties not playing a significant role.
I also have available data on the results of both the 2015 election (by constituency and again, I’m only considering the \(C=632\) constituencies in England, Scotland and Wales \(-\) this leaves out the 18 Northern Irish constituencies) and the 2016 EU referendum. I had to do some work to align these two datasets, as the referendum did not consider the usual geographical resolution. I have mapped the voting areas used 2016 to the constituencies and have recorded the proportion of votes won by the \(P\) parties in 2015, as well as the proportion of Remain vote in 2016.
For each observed poll \(i=1,\ldots,N_{polls}\), I modelled the observed data among “\(L\)eavers” as \[y^{L}_{i1},\ldots,y^{L}_{iP} \sim \mbox{Multinomial}\left(\left(\pi^{L}_{1},\ldots,\pi^{L}_{P}\right),n^L_i\right).\] Similarly, the data observed for ” \(R\)emainers” are modelled as \[y^R_{i1},\ldots,y^R_{iP} \sim \mbox{Multinomial}\left(\left(\pi^R_{1},\ldots,\pi^R_P\right),n^R_i\right).\] In other words, I’m assuming that within the two groups of voters, there is a vector of underlying probabilities associated with each party (\(\pi^L_p\) and \(\pi^R_p\)) that are pooled across the polls. \(n^L_i\) and \(n^R_i\) are the sample sizes of each poll for \(L\) and \(R\).
I used a fairly standard formulation and modelled \[\pi^L_p=\frac{\phi^L_p}{\sum_{p=1}^P \phi^L_p} \qquad \mbox{and} \qquad \pi^R_p=\frac{\phi^R_p}{\sum_{p=1}^P \phi^R_p} \] and then \[\log \phi^j_p = \alpha_p + \beta_p j\] with \(j=0,1\) to indicate \(L\) and \(R\), respectively. Again, using fairly standard modelling, I fix \(\alpha_1=\beta_1=0\) to ensure identifiability and then model \(\alpha_2,\ldots,\alpha_P \sim \mbox{Normal}(0,\sigma_\alpha)\) and \(\beta_2,\ldots,\beta_P \sim \mbox{Normal}(0,\sigma_\beta)\).
This essentially fixes the “Tory effect” to 0 (if only I could really do that!…) and then models the effect of the other parties with respect to the baseline. Negative values for \(\alpha_p\) indicate that party \(p\neq 1\) is less likely to grab votes among leavers than the Tories; similarly positive values for \(\beta_p\) mean that party \(p \neq 1\) is more popular than the Tories among remainers. In particular, I have used some informative priors by defining the standard deviations \(\sigma_\alpha=\sigma_\beta=\log(1.5)\), to mean that it is unlikely to observe massive deviations (remember that \(\alpha_p\) and \(\beta_p\) are defined on the log scale).
I then use the estimated party- and EU result-specific probabilities to compute a “relative risk” with respect to the observed overall vote at the 2015 election \[\rho^j_p = \frac{\pi^j_p}{\pi^{15}_p},\] which essentially estimates how much better (or worse) the parties are doing in comparison to the last election, among leavers and remainers. The reason I want these relative risks is because I can then distribute the information from the current polls and the EU referendum to each constituency \(c=1,\ldots,C\) by estimating the predicted share of votes at the next election as the mixture \[\pi^{17}_{cp} = (1-\gamma_c)\pi^{15}_p\rho^L_p + \gamma_c \pi^{15}_p\rho^R_p,\] where \(\gamma_c\) is the observed proportion of remain voters in constituency \(c\).
Finally, I can simulate the next election by ensuring that in each constituency the $^{17}_{cp} $ sum to 1. I do this by drawing the vote shares as \(\hat{\pi}^{17}_{cp} \sim \mbox{Dirichlet}(\pi^{17}_1,\ldots,\pi^{17}_P)\).
In the end, for each constituency I have a distribution of election results, which I can use to determine the average outcome, as well as various measures of uncertainty. So in a nutshell, this model is all about i) re-proportioning the 2015 and 2017 votes based on the polls; and ii) propagating uncertainty in the various inputs.
I’ll update this model as more polls become available \(-\) one extra issue then will be about discounting older polls (something like what Roberto did here and here, but I think I’ll keep things easy for this). For now, I’ve run my model for the 5 polls I mentioned earlier and this is the (rather depressing) result.
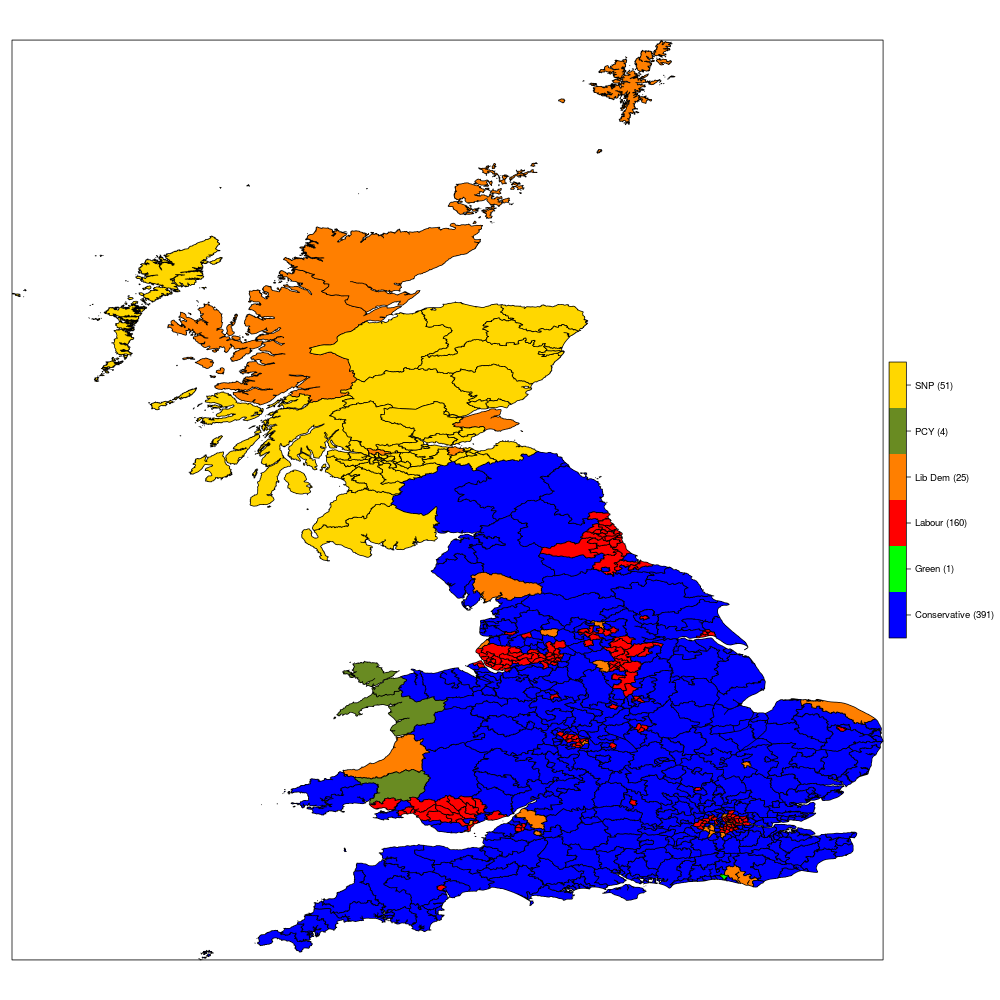
From the current data and the modelling assumption, this looks like the Tories are indeed on course for a landslide victory \(-\) my results are also kind of in line with other predictions (eg here). The model here may be flattering to the Lib Dems \(-\) the polls seem to indicate almost unanimously that they will be doing very well in areas of a strong Remain persuasion, which means that the model predicts they will gain many seats, particularly where the 2015 election was won with a little margin (and often they leapfrog Labour to the first place).
The following table shows the predicted “swings” \(-\) who’s stealing votes from whom:
| Conservative | Green | Labour | Lib Dem | PCY | SNP | |
|---|---|---|---|---|---|---|
| Conservative | 325 | 0 | 0 | 5 | 0 | 0 |
| Green | 0 | 1 | 0 | 0 | 0 | 0 |
| Labour | 64 | 0 | 160 | 6 | 1 | 1 |
| Liberal Democrat | 0 | 0 | 0 | 9 | 0 | 0 |
| Plaid Cymru | 0 | 0 | 0 | 0 | 3 | 0 |
| Scottish National Party | 1 | 0 | 0 | 5 | 0 | 50 |
| UKIP | 1 | 0 | 0 | 0 | 0 | 0 |
Again, at the moment, bad day at the office for Labour who fails to win a single new seat, while losing over 60 to the Tories, 6 to the Lib Dems, 1 to Plaid Cymru in Wales and 1 to the SNP (which would mean Labour completely erased from Scotland). UKIP is also predicted to lose their only seat \(-\) but again, this seems a likely outcome.